Industry
Top 5 KPIs: James Courtman
We caught up with James Courtman about the Top 5 Key Performance Indicators (KPIs) that he focuses on across his dairy operations, from both 'on-the-ground' and shareholder/director perspectives. While farming overseas James picked up some useful measures that he’s blended into his practices back here in New Zealand.
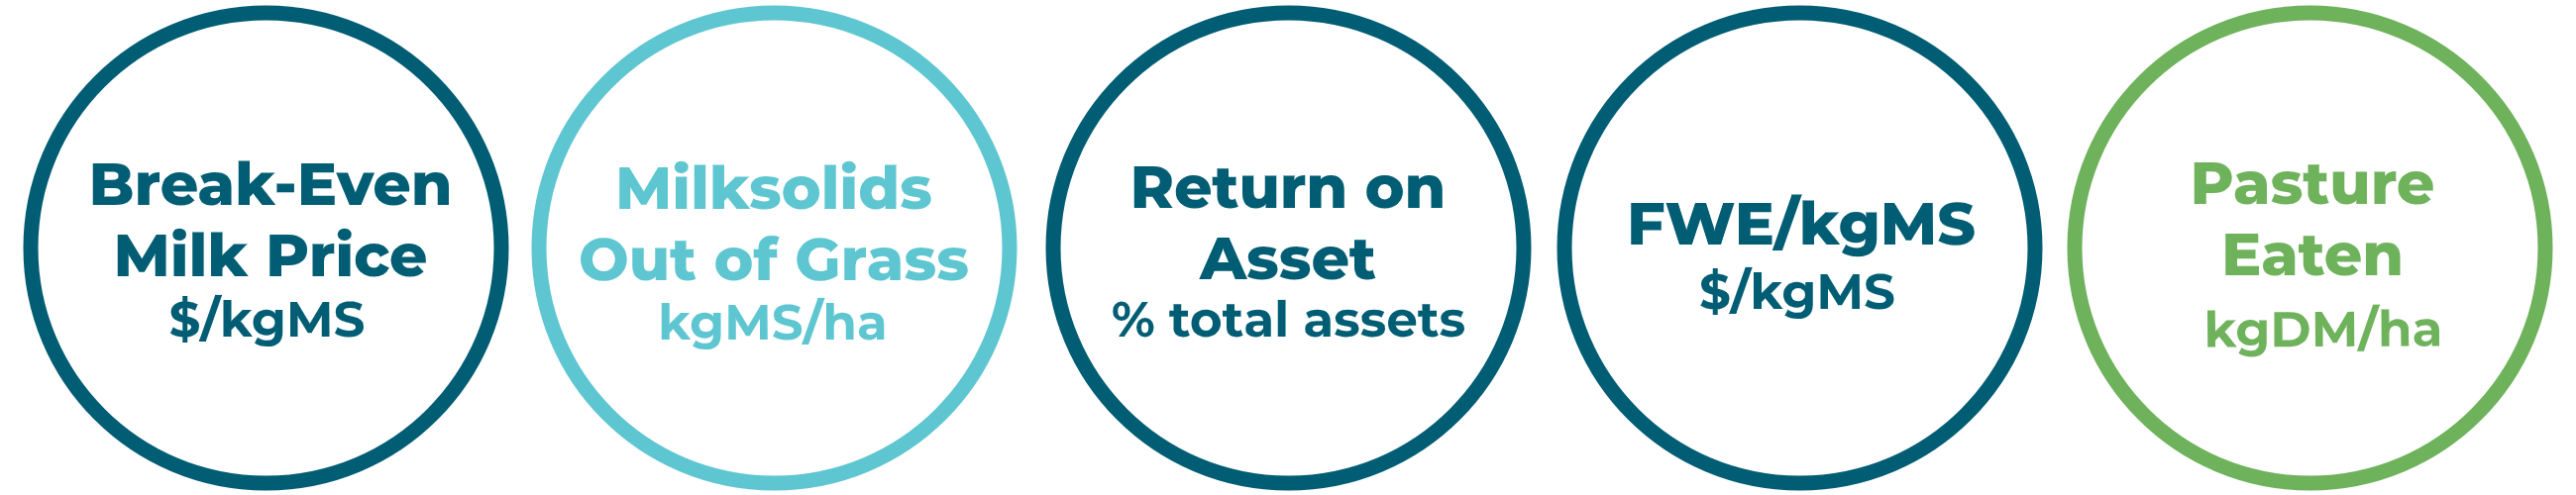
1. Break-even milk price ($/kgMS)
Break-even milk price is the milk income per kilogram of milksolids required to cover all costs or outgoings. It’s calculated by dividing your total expenses by total milksolids production and is essentially the tipping point in your business where you can stay afloat without borrowing money to operate. It gives you an idea of how financially resilient your business is and what milk-price environments you can survive in. If the industry were to move into a medium to low, or low milk price cycle, having that knowledge allows you to plan what you need to do to evoke change, whether that’s entering into hedging tools, doing something to your cost structure on farm or talking to your bank. In really low milk price environments you can cut some costs out of farm working expenses but you generally can’t cut it down a lot unless you really change your production system, so measuring your break-even milk price gives you options during those dips.
We look at this KPI annually at the start of the year when setting budgets to get a feel for what we’re working towards, and then again at the end of the year to see how close we got to that number. We also look at how it’s trending over time; if it’s gone up by 20 or 30 cents we’re able to go through the rest of our cost structure for the season to see if the increase has made sense. If it’s gone up because we’ve spent money on houses, or R&M, that’s fine - if it's gone up because we’ve added some more supplement to our system and have very little extra production to show for it, it becomes more concerning and a reason to dig deeper.
2. Milksolids out of grass (kgMS/ha)
This is where we take per hectare milk production, then reverse out the milksolids response from any supplementary feed to leave a residual production level purely from grass.
We found that the guys that measure milksolids out of grass and implement that information well are the ones that drive the milk solids out of grass first, no matter what production system they’re using, and from there it simply depends on their preference as to how much supplement is added on top.
After using this extensively in Chile I’ve implemented this metric back here in New Zealand.
There’s a bit of an art to determining the milksolids response from supplements, but reviewing this KPI regularly keeps these expected response rates in check. This is beneficial for farmers because there is more supplement going into farms these days compared with 10-15yrs ago, so it’s good to know what you’re actually getting out of the grass you’re growing.
3. Return on asset (% total assets)
This is one metric that gives an overall idea of your financial stability and growth, and one that I’ve been aiming to build on for our business. Looking at the return you’re getting on your physical assets is an important financial metric because it gives you a good indication of whether your investments are worthwhile, and your options when it comes to putting money in the bank or life outside of farming. If your return on asset is greater than the cost of borrowing funds then your return on equity will be even higher, and if that’s the case you know your business is growing well. This metric is especially important if you’ve got a large amount of debt.
4. Farm working expenditure per kg of milksolids ($/kgMS)
I look at our on-farm costs once a month. Measuring how much we’re spending on supplements or how high our animal health bills are compared to our production means we have more control over the day-to-day running of the farm and gives me a good indication of how we’re tracking versus budget, what areas we’re overspending on, and why. Some areas might be because of a bit of bad luck, or something broke down and we didn’t expect it to. But looking deeper at what we’re getting out of the money we’re putting in enables us to make changes to improve our farm performance and productivity on a daily basis.
Because we look at those numbers so often, we use them to inform our financial forecasts and to adjust budgets throughout the year.
5. Pasture eaten (kgDM/ha)
This one has a little bit of double up with milksolids out of grass, but your pasture eaten per hectare has a huge bearing on farm profitability. It doesn’t matter what system you’re running, the more grass you can harvest the better, and to drive a high pasture eaten metric you need to be growing plenty of it.
This KPI has always been a big one in all the farm systems I’ve been in and something that was instilled in me by everyone at the start of my farming career. Whenever I’ve used DairyBase it’s been one of the first KPIs I measure, to see how much pasture we’ve grown, how much is eaten, whether we can move it and how well we compare with the area district average.