Industry
Top 5 KPIs: Cameron Henderson
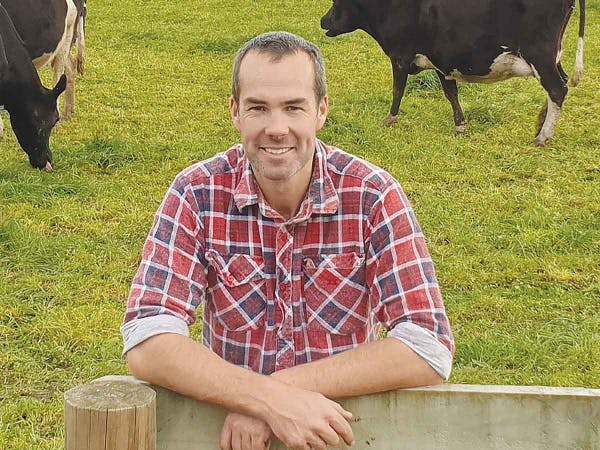
“At the end of the day, we need to be proud of what we do and believe in what we are doing and this is really important for the longevity of farming and allowing us all to continue to do what we do on the land”.
- Cam Henderson, Oxford farmer, Ballance director, and He Waka Eke Noa steering committee member
Cam Henderson farms with his wife and two children near Oxford, North Canterbury. Cam is also a director of Ballance and a Steering Committee member for He Waka Eke Noa. As a passionate advocate for sustainable agriculture, Cam shares his Top 5 KPIs which focus on achieving a balance of productivity, profitability and sustainability.
Nutrient Loss
The evolution of farming in New Zealand has seen us shift from thinking about productivity as number one, then to profitability, and now this focus has had to expand to recognise the environmental impact.
Managing nutrient loss is now the ticket to the game and is now necessary for me to continue to dairy farm in Canterbury. In order to measure this I look at nitrogen loss per hectare as it’s modelled through Overseer. It’s important to note that there isn’t an exact answer that applies to all here - everybody is on a different stage of their journey and everybody’s outcomes will be different whether that be environmentally or socially - people want different things out of their farming businesses. For where we’re at on our farm journey I consider a good result to be a nitrogen loss that is less than the season before - so right now my target is to get below 40, I’m currently at 42.
Measurement will no doubt always start as a tickbox exercise but if I’m to use myself as an example, as my system has evolved I have more clearly understood why this is important for biodiversity and greenhouse gases etc - for me it’s the right thing to do for the environment.
What we do have to take into consideration now though is that our neighbours' choices and decisions, and their impact on the evolving regulations, are now starting to impact the on-farm decisions we are able to make So the faster we can get everybody through the evolution of thinking, the better off we’ll all be.
Variance to budget
This KPI takes the general principle of comparing a range of different line items - whether productivity, profitability or sustainability focused - and using last year as the baseline. I also like to compare against budget throughout the year.
It’s important for me to understand the variance to budget of my on-farm input costs and the resulting production as it helps me to ascertain if we’ve seen the expected outcome from our plan. For example if we’ve spent more, has it paid off? If we’ve spent less have we got the expected outcome?
You can’t always forecast for things like climate so it’s to be expected that there will be some variance year to year and that’s not a bad thing, it’s just acknowledging that it exists and understanding why.
This is about getting a better understanding of controlling what we can by delving into the detail. For example, what’s cost more or less than last year? Why have we produced more or less than the year before and what are the reasons for this?
In the past I’ve struggled to benchmark my farm against my neighbours as we run quite different systems so I have found benchmarking against my farm’s performance year on year to be quite a useful exercise as it helps to understand what has changed relative to plan and why. I think there’s things that can always be learned from this retrospective review, it allows us to take stock of how we went for the season, discuss what we should be doing differently, and gives us an understanding of how we can plan better for the next season.
Imported feed fed
Here I look at imported feed to the dairy system (excluding winter feed).
Most of the farm’s production KPIs are heavily influenced by this so it is important to understand how much of an influence it is having on production and costs - ideally we want to avoid any creep where we can.
This measurement provides a really good indicator of how we are sitting in terms of intensity of our system. It is also the biggest variable cost in our system and can come with a pretty hefty pricetag so it’s something I want to keep a particularly close eye on.
We’re always targeting ways to use less imported feed of better quality over time. This obviously depends on the season and the payout cycle we’re in.
GHG emissions
There is no doubt that Greenhouse Gas emissions will become a cost on the P&L soon so we need to identify ways to reduce emissions such as methane, nitrous and Co2 production.
There are currently 11 approved calculator tools to measure greenhouse gas emissions on farm - these can be found on the He Waka Eke Noa website. I personally use Overseer as we have roughly eight years of history with the programme so it’s easy for me to do scenario testing and map trends over time.
For me right now it's a bit of a watching brief to see how it will all impact our system with more benchmarks coming out soon. Right now, my aim is to keep below the national average and improve on how the farm performed last year.
Farm working expenditure
As dairy farmers in Canterbury we expect production to be reasonably stable so the focus goes on farm working expenses and bringing those down where we can. To calculate farm working expenses per productive hectare I look at the expenditure side of EBIT, taking the revenue out.
For me this is one one of the easier figures to benchmark and it allows you to identify variances in cost structure. I find it particularly useful to help with my own learnings and to improve my own farm system. If you can understand why other farms running similar systems might be doing better (and why) it can help with your own on-farm decisions. For me, good looks better than my number last year and sees me closing in on leading farms in the area.