Industry
Industry Insight: Pasture Surplus - Nov 2020
Trev’s pulled out the pencil, rubber and Casio SX300 calculator to generate some fresh insights to share with the dairy community.
The charts below look at the week on week pasture surplus/deficit on the effective milking platform for spring-calving dairy farms in Waikato, Canterbury and Southland for the current season-to-date relative to last year. This provides an interesting view of how pasture supply and demand (outside of supplementary feed) has been matched over the last 18 months.
Waikato
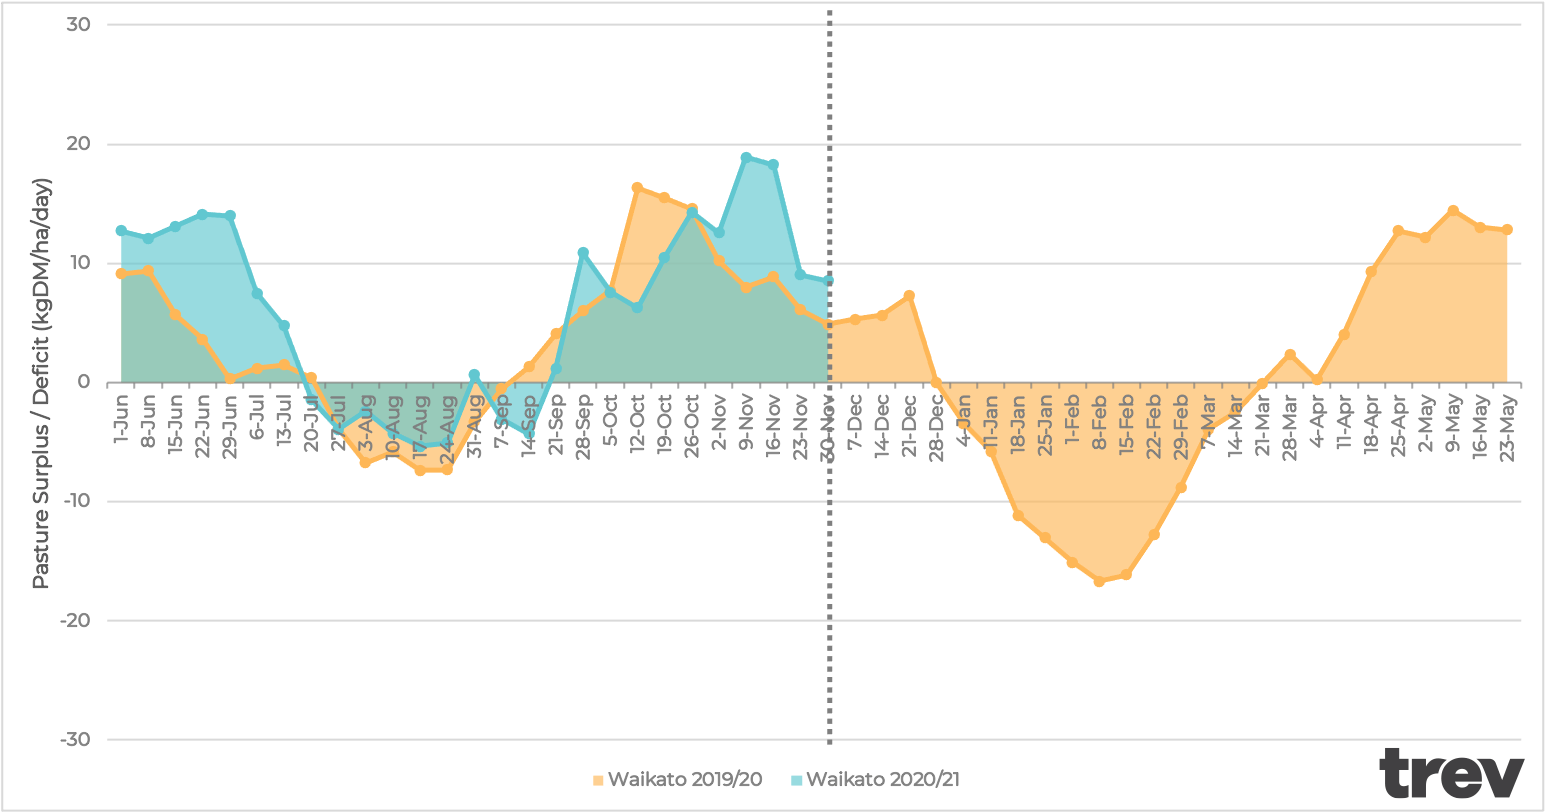
- Strong growth rates saw a larger pasture surplus through the winter period. This was key in rebuilding pasture cover following the drought in the first half of the calendar year.
- These growth rates continued through the early lactation period which meant the pasture deficit relative to last year was materially lower.
- Strong pasture surpluses have been built in late spring such that cumulative season-to-date surplus to the end of November is approximately 68% more than for the same 6 month period last season.
- Perhaps the most intriguing feature of the Waikato chart is the huge impact of the drought in the second half of lactation last season. Note that, as this chart demonstrates pasture surplus / deficit rather than simple growth rate, it has the reactionary measures of destocking and early dry-off etc. factored in. That is, a management engineered surplus emerges at the end of last season.
Canterbury
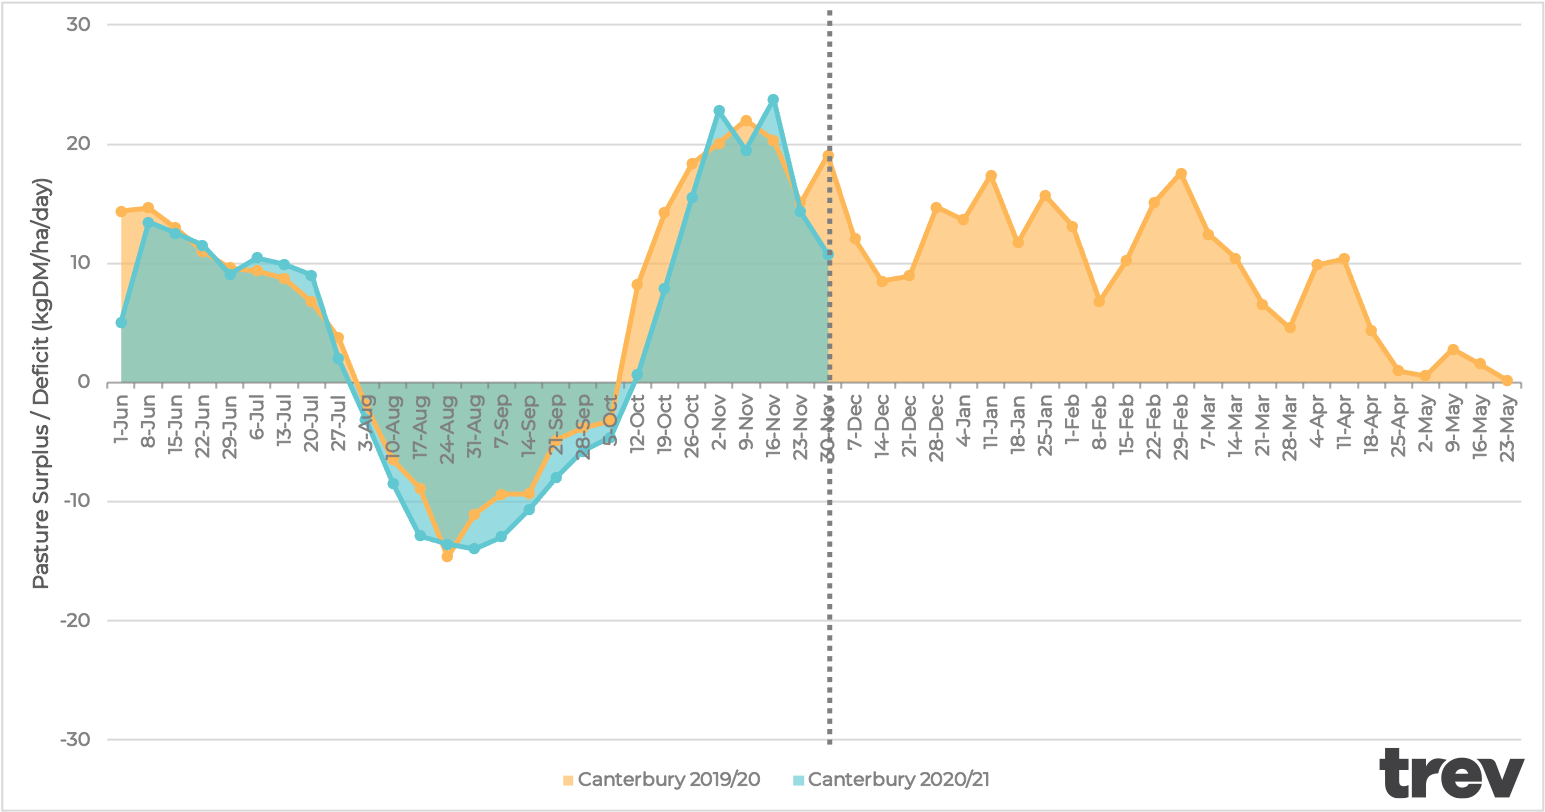
- The Canterbury chart shows a largely similar trajectory season-on-season, particularly through the winter period.
- However, early lactation saw a deficit approximately 27% greater (deeper) than last season.
- Following the mid-October balance date, this difference to last season continued and cumulative season-to-date surplus to the end of November is approximately 33% less than for the same 6 month period last season.
- Through November the week-on-week comparison to last season has evened out.
Southland
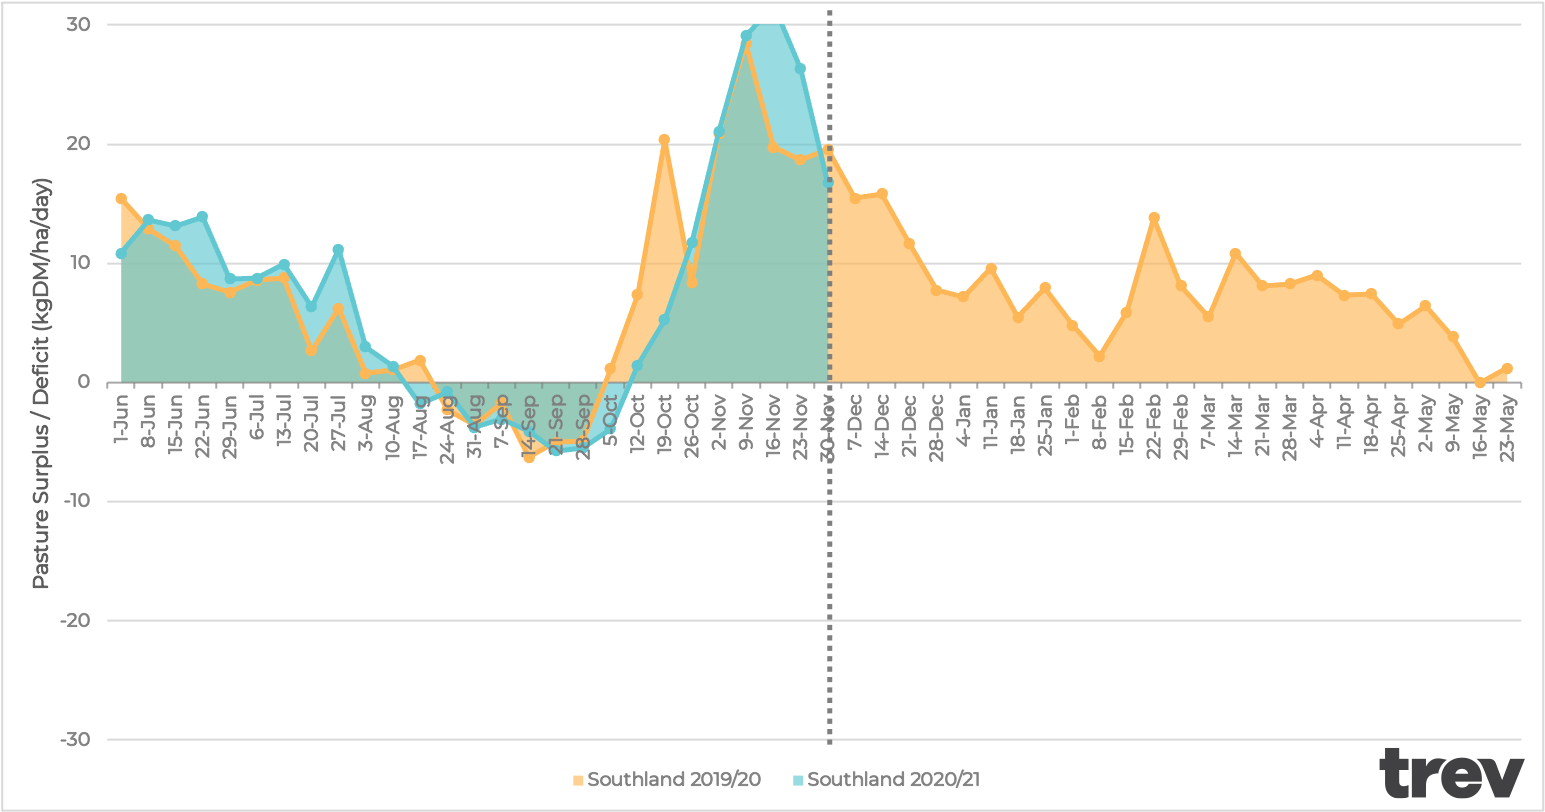
- The pasture surplus/deficit curve for Southland shows a stronger position than last year through to the end of September.
- During October the relative surplus/deficit was weaker than last season and in fact shows a balance date that is later by approximately 1x week.
- The cumulative season-to-date surplus to the end of November is roughly on par relative to the same 6 month period last season.
If you’d like to understand the data a little more, or find out how you can get your own farm insights, drop us a line on the Intercom chat.