Product
Solving the headache of data manipulation
The most proficient and spreadsheet-savvy operators will attest to the challenges of trying to regularly collect data to quickly and meaningfully compare farms, seasons, or both. The mechanics of trying to analyse relative performance, and then understanding what the resulting data presents, can be like opening a Pandora’s Box of “what-ifs”, “maybes” and “how comes?”
To take away some of this pain, Trev has created a new tool to help crunch and manipulate data, into useful and comparable insights for farmers and their trusted partners.
What is Gap Analysis?
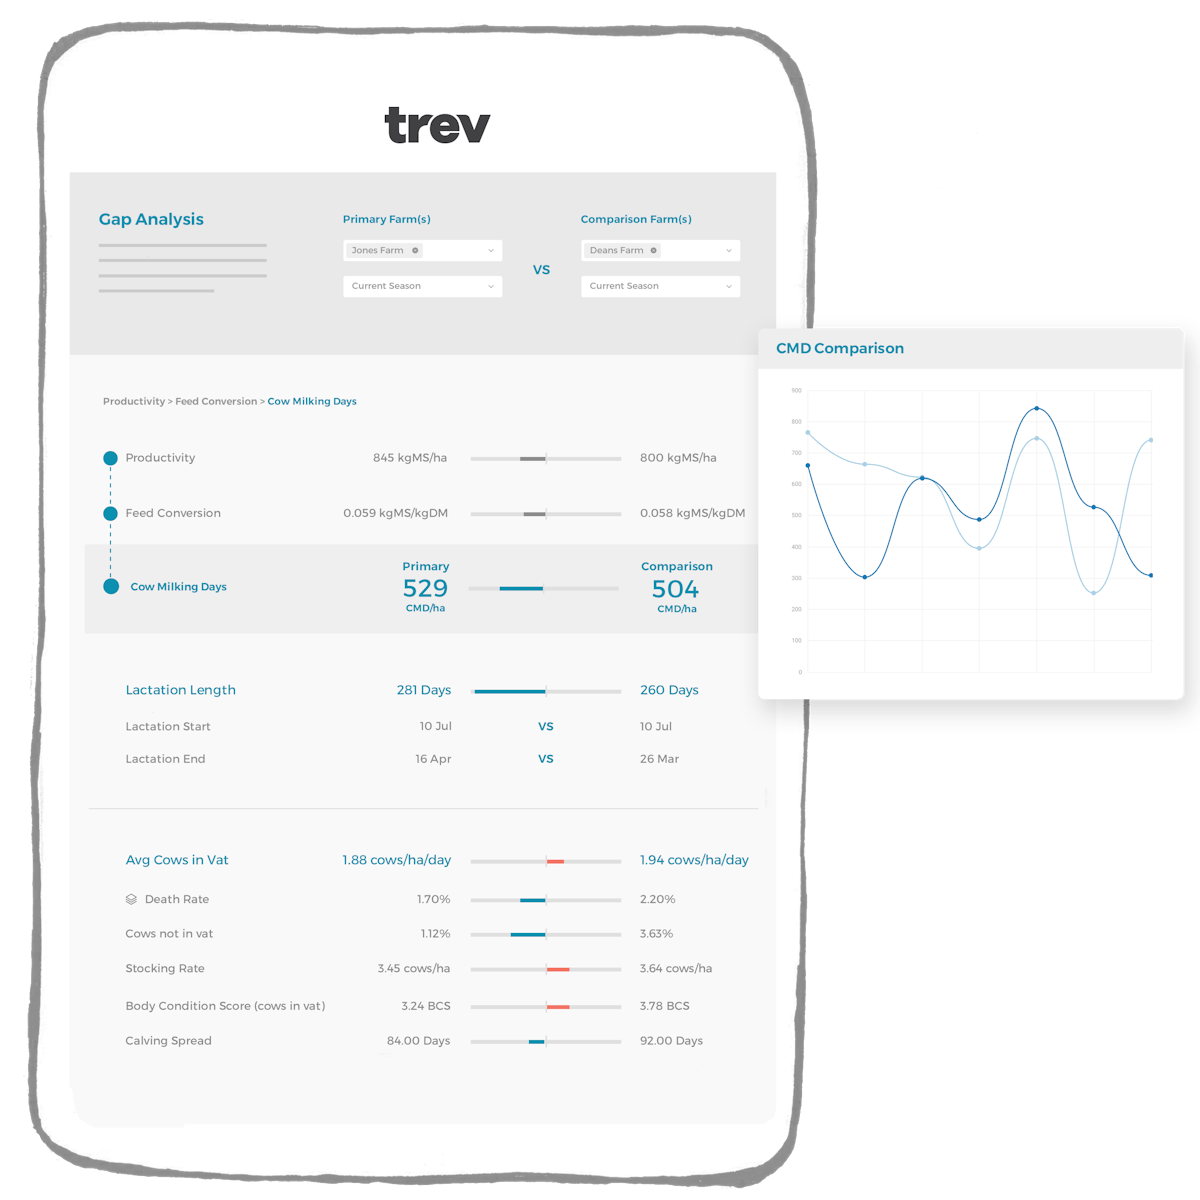
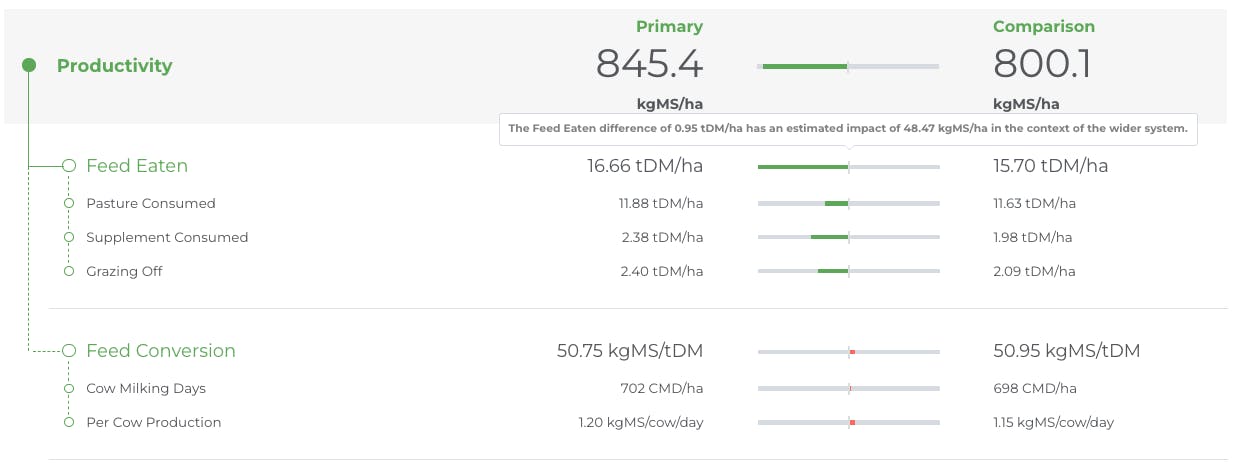
Trev’s Gap Analysis tool enables users to quickly identify and drill into the key drivers of productivity variance between farms. Users are able to compare metrics right across the farm system and quickly get an estimate of the relative impact on overall productivity performance (kgMS/ha). The Gap Analysis tool is based on a hierarchy of metrics so Trev users can drill down further to determine the efficiency of their farm’s milksolids per hectare output. This could include determining the milksolids produced per kg of feed intake, for example, identifying areas of favourable or unfavourable performance in a few clicks.
How does Gap Analysis work?
Users select a ‘primary’ farm and season, and a ‘comparison’ farm and season to benchmark against. The “gap” in performance between the farms and the estimated impact of that gap to overall productivity is displayed (in units of kgMS/ha).
The benefits of a comparative system are immediate. Gap Analysis helps to free up time which can then be spent fine tuning the farm system. The tool also presents the detail. For example, the individual components of feed such as pasture, supplement and grazing off can all be examined for their individual roles in total milk production. This helps to remove the bias that inevitably accompanies a “top line” figure like kgMS/ha performance, going much further to determine whether that figure was achieved in a most feed efficient manner, or not.
The future of Gap Analysis
With users already entering key info about their operational farm KPIs into their Trev farm database the hard graft of data collection is taken care of. Trev also automatically cleanses, standardises and stores this data, attending to data management. Logically then, the next step was to allow Trev users to compare and contrast two farms’ performance against each other, or look at an individual’s farm’s performance across different seasons.
Trev currently focuses on productivity KPIs, but as the system develops users can expect to have access to Gap Analysis that is capable of profitability ($/ha) or sustainability measures (GHG/ha).
In the near future Trev will look to introduce:
- multi-farm selection to aggregate farms and compare them in groups,
- custom date selection to enable users to compare specific points in historic seasons,
- reference datasets so users can begin to compare a farm to a regional average or reference farm.
Gap Analysis is now available to all Trev Pro users.
Want to know more about Trev Pro? Click to read more.